How I spent my time in the Spring 2024 semester
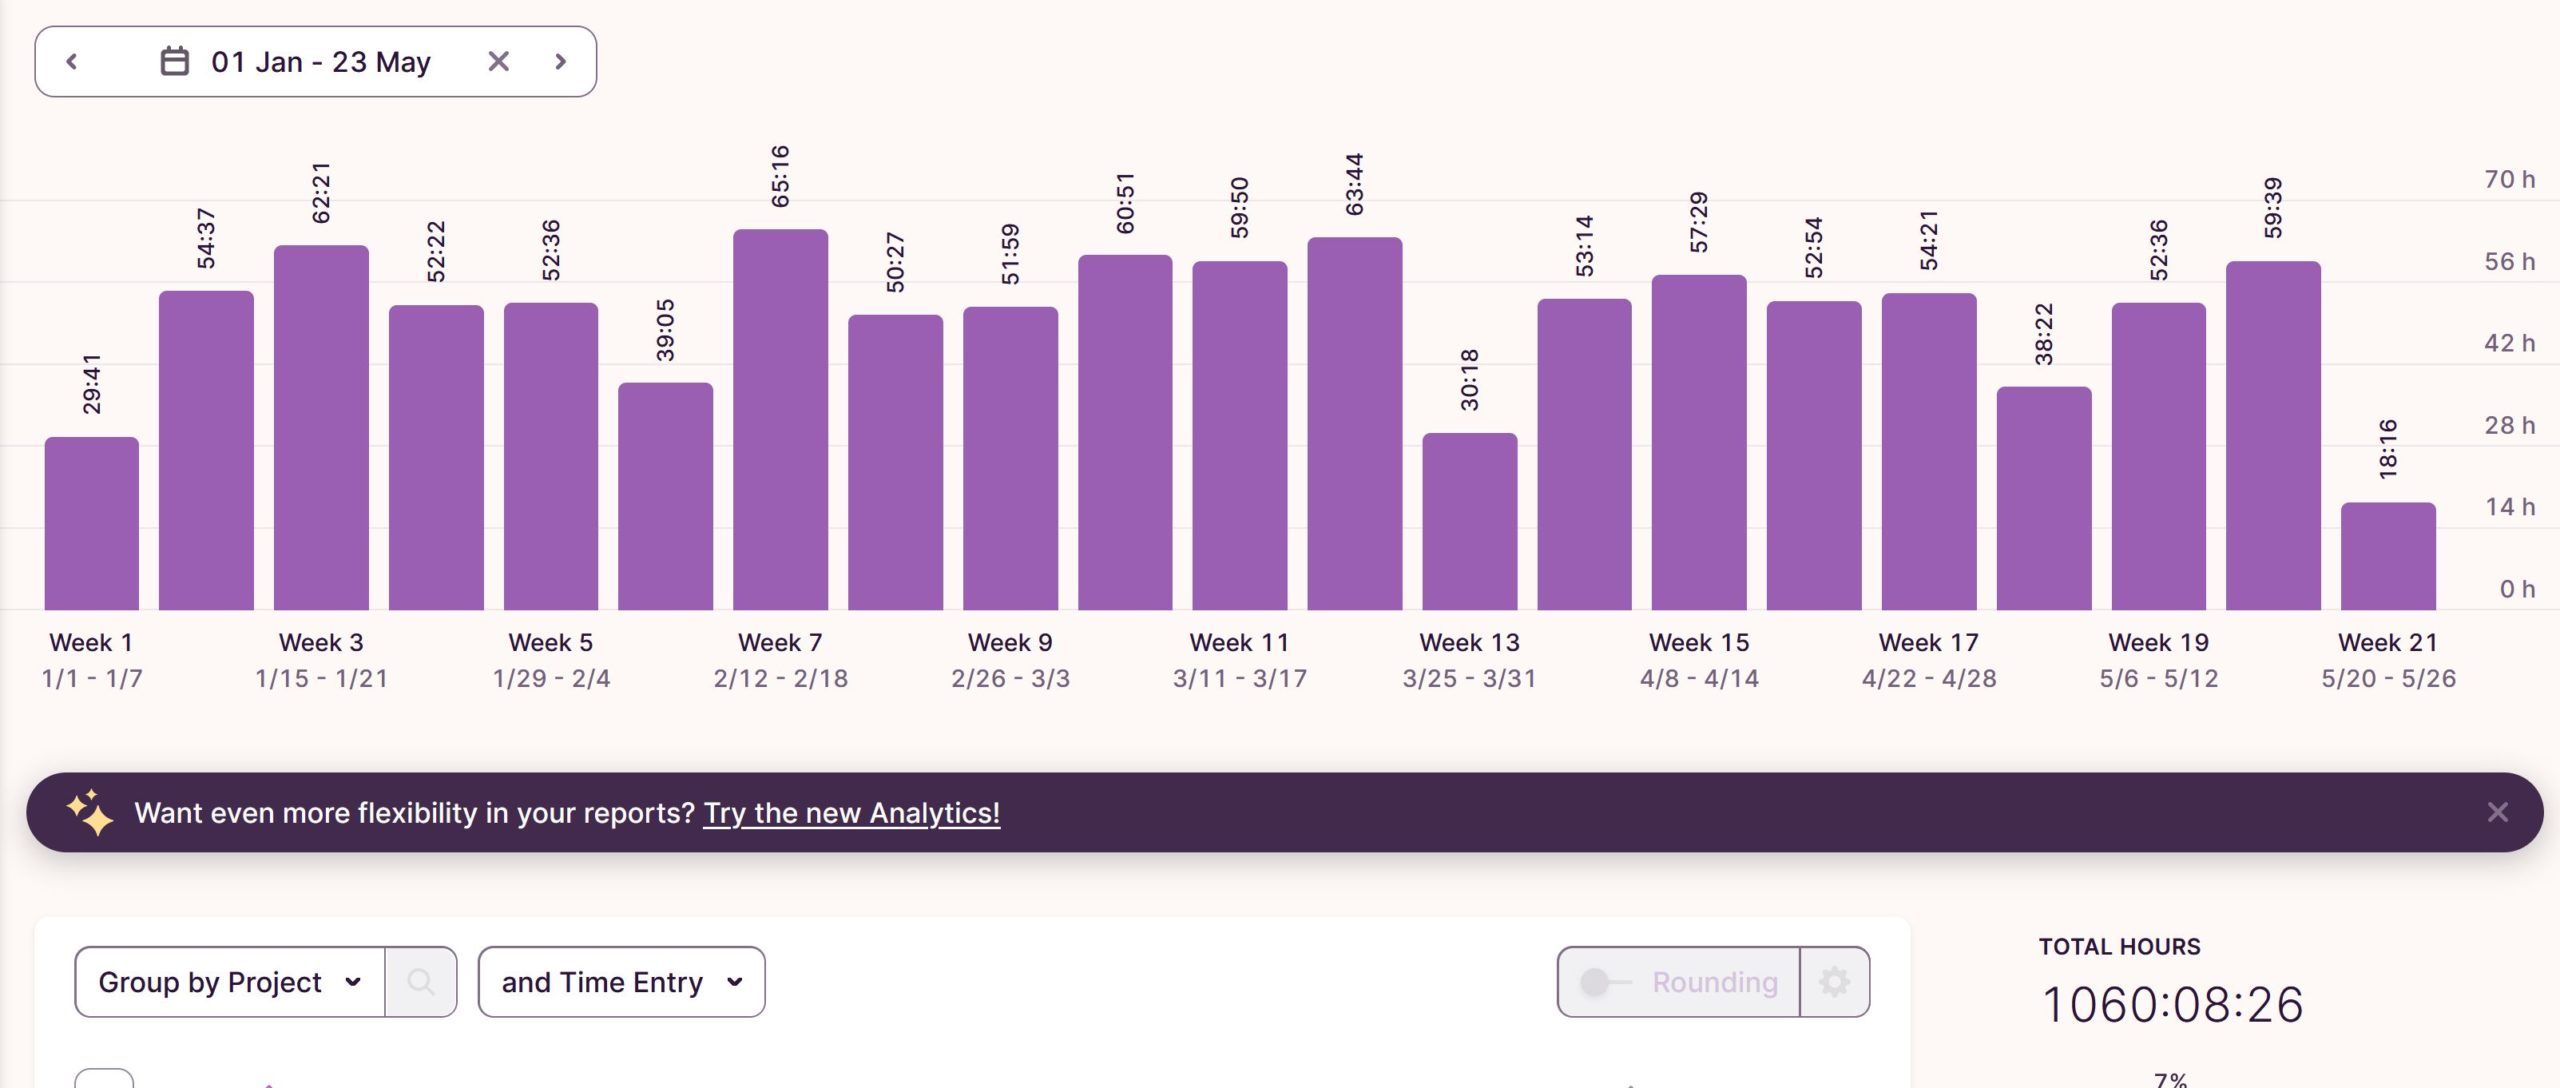
At the end of every semester, I look at the data in my Toggl reports to see how I spent my time.
Here’s how I spent my time in Spring 2024:
- Conferences: 10.39%
- ACI Avances: 9.59%
- Research proposals: 9.50%
- Service: 9.40%
- Teaching: 8.80%
- Papers: 7.84%
- Admin: 6.92%
- Research project 1: 4.18%
- Teaching TU: 4.08%
- Learning: 3.88%
- PhD project 1: 2.64%
- Meetings: 2.16%
- PhD project 2: 2.15%
- Meeting TU: 2.12%
- Planning: 2.06%
- Research: 2.05%
- Research project 2: 1.95%
- Blog: 1.88%
- PhD project 3: 1.86%
- Promotion: 1.63%
- PhD project 4: 1.51%
- PhD project 5: 1.05%
- PhD project 6: 0.74%
- Cooperation: 0.52%
- PhD project 7: 0.37%
- Research project 3: 0.35%
- PhD project 8: 0.21%
- Without project: 0.16% (sorry, not sure what happened here…)
- Email + admin: 0.01% (I’ve been mostly tagging email as part of the projects they belong to)
Here are a few observations from the data:
- It has been a busy semester and I have worked a lot (and also, a lot of hours)
- Teaching has taken a bit less time (as percentage, at least, not sure how the total numbers pan out) as I do not have any new course to develop this semester.
- I’ve ramped up the time spent on writing proposals, as that is where I am at in this season.
- Avances took a lot of time this semester, as we are applying to indexations and revamped our website.
- All in all, I am quite happy with how I planned and spent my time this semester.