How I spent my time in 2025
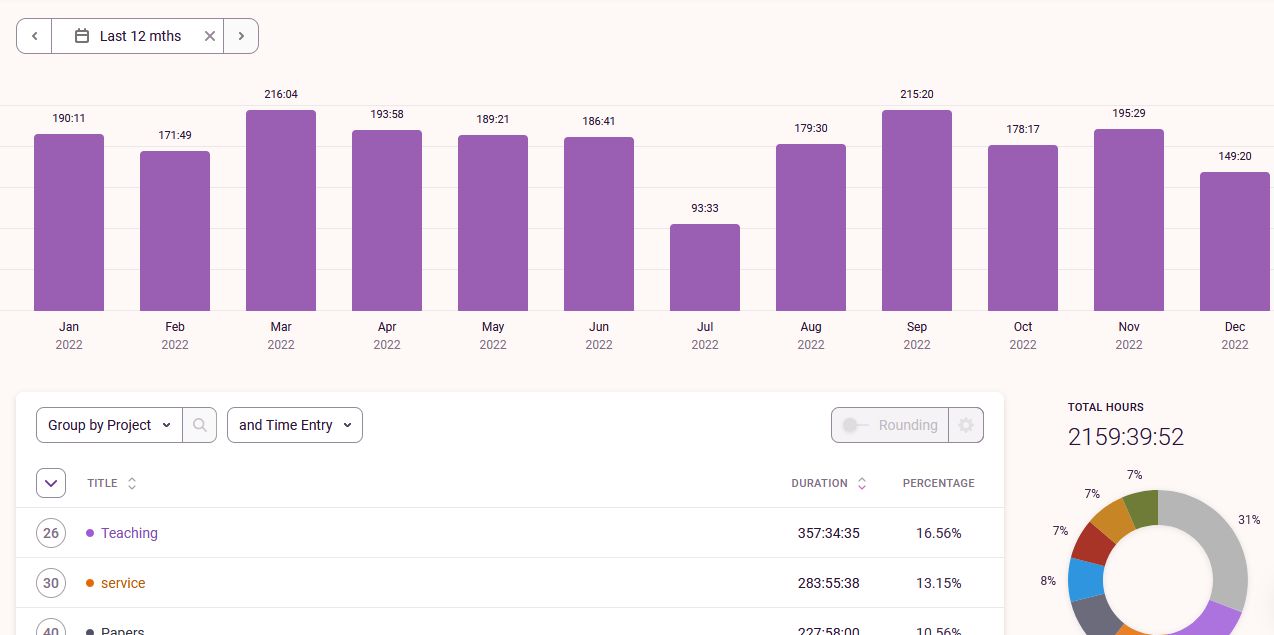
At the end of every year, I check my Toggl stats to see how I spent my time. My first observation from 2025 is that I worked more hours than any tracked year before (I need to keep an eye on this – I know that I’ve been putting in a lot of extra time as I’ve been working hard on getting funding for the next years, but structural overwork is not the solution). Not surprisingly, research proposals is the category that took most of my time.
Here’s how I spent my time in 2025:
- Research proposals: 18.12%
- Service: 11.5%
- Teaching: 11.2%
- Conferences: 10.3%
- Papers: 9.01%
- Research: 7.23%
- ACI Avances: 7.1%
- Meetings: 4.27%
- Admin: 2.96%
- PhD project 1: 2.46%
- BEST: 2.41%
- PhD project 2: 2.25%
- Planning: 1.49%
- PhD project 3: 1.34%
- Blog: 1.13%
- Brandwerendheid: 1.04%
- PhD project 4: 0.9%
- Learning: 0.82%
- Email + admin: 0.73%
- Poligrant 2025: 0.61%
- PhD project 5: 0.52%
- Collaboration with country X: 0.49%
- PhD project 6: 0.38%
- PhD project 7: 0.37%
- HUC Seed Fund CIRCA: 0.28%
- Without project: 0.21%
- Student help: 0.17%
- PhD project 8: 0.14%
- PhD project 9: 0.13%
- Poligrant Vinculación 2025: 0.11%
- PhD project 10: 0.09%
- PhD project 11: 0.08%
- Industry work: 0.08%
- PhD project 12: 0.04%